Well, that title pretty much sums up my solar energy update. Thanks for reading!
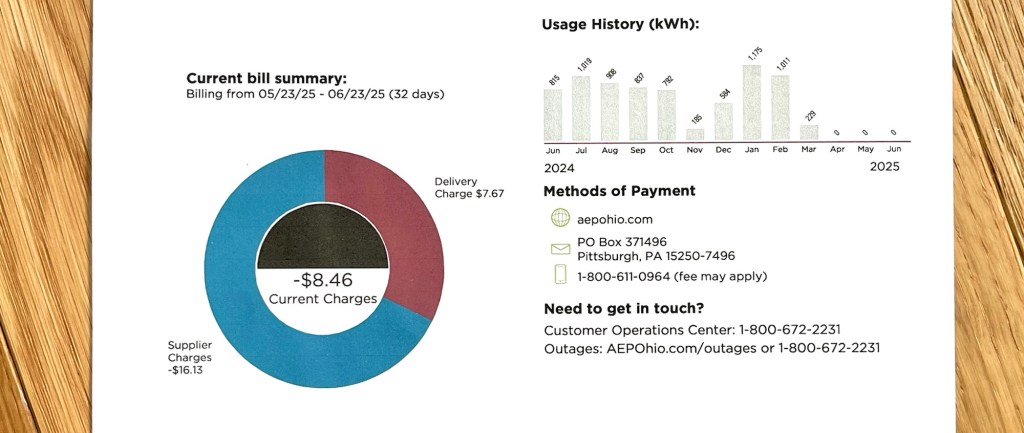
Okay, okay. It’s said that brevity is the soul of wit, but you know I can’t keep it that short. There’s a lot more to this solar update than the result of my May and June electricity bills, which greeted me pleasantly with the phrase “no payment is due at this time.” Best words in the billing business, if you ask me. Aside from “Oops, we goofed. Here’s your refund check.” Alas.
There are a few things I want to cover here. What was my expected electricity consumption so far? How has that matched up with my actual usage? And what about the solar production side of things? Let’s get to it.
As part of the energy modeling I did for passive house certification, I calculated the total energy needs per year. My software breaks it down to monthly data, which I’ve shown on the graph below in dark orange dots. In case you’re color blind, they’re the round dots. If you’re color blind and shape blind, they’re the ones below the x axis. If you experience color blindness, shape blindness, and spatial disorientation, there’s no way you can read this graph. You may need to see a doctor.
Using my energy model’s estimate of total annual energy consumption, I was able to size my solar array. A report by the installer also broke down production estimates into monthly data, shown as blue, diamond-shaped dots.
The solar array was put into service on October 29th, 2024. For simplicity, I’ve ignored the first three days of service and initialized the Clintonville Passive House Solar Year at November 1st. That means thus far I’ve had eight full months of actual production and consumption data to compare to my estimates. So, what are the conclusions?

Over the initial eight-month period we’ve actually used 7,840 kWh. That’s more than the calculated 6,780 kWh from the energy model by a nearly 16% margin. Bummer.
For slightly-less-bad news, let’s turn our attention to solar production. Compared to a calculated 5,970 kWh, we actually made 5,450 kWh. That’s 9% less than target. Still a bummer, but not quite as bad. May and June seem to be to blame for most of the production underperformance, though April production still lagged estimates.
CPH is clearly not net zero at the moment. We’re actually in the hole by about 2,390 kWh, or at about 70% of net zero in other terms. But hold on. According to my models, at this time of year I would expect to be in the hole (with consumption outpacing production by around 800 kWh). We still have four months to go in the CPH Solar Year, and this is a time period when we should be able to make a fair amount of excess solar energy. However, we also will probably be using a little more energy in July and August compared to June, as indicated by those dark orange “projection” dots. It will be difficult, if not impossible to catch all the way back up to net zero by the end of October.
Here are some positive takeaways: For November, April, and May CPH was actually net positive, meaning the solar array produced more energy than the house used over those months. June was close. We had to still pay a small amount to our electricity utility in November and April, due to a billing cycle offset in November and a barely-positive April (we still have to pay some customer fees even when we’re at net zero). May and June bills didn’t require any payment, though, because our amount of solar production actually covered all the customer, distribution, and generation charges for those months. And we currently have over eight bucks saved up as credits for the next bill. Not bad! We should be able to ride the credit wave until November, at least.
The negative is clear, though—for our first year, we may not achieve net zero performance. So, why the discrepancies? Well, there’s always going to be some yearly variation in sunshine as well as temperature and humidity (which have a large effect on HVAC demand). Probably plus or minus some single-digit percentage is typical.
But here’s my list of specific excuses reasons why solar production may have been lower than average for January, February, May, and June:
- We had lots of snow in January and February. It stayed stubbornly on the roof from January 3rd-12th and again from February 15th-22nd, even while the sun was shining nicely but at temperatures that mostly peaked in the teens—colder than average. At least I was still getting substantial passive solar through the windows to help with heating.
- April was a little rainier than average. May 2025 was the 12th wettest on record since 1879.
- We had the 19th wettest June since 1879 (therefore cloudy) here in central Ohio—significantly more than average years. It was also hotter than average. Both of these aspects—hot and humid—meant higher air conditioning loads than would be expected.
And here are some thoughts on why consumption might have been higher than expected:
- Consumption is significantly influenced by occupant behavior. Even with pains taken to account for all sources of energy use by people living in a building, sometimes an energy model’s prediction doesn’t match up to actual use.
- Uneven distribution of conditioned air. My basement wants to stay a few degrees cooler than upstairs and sometimes needed supplemental space heating in winter even when the upstairs was right at the set point, or slightly above. Also, in summer, it would be useful to push excess heat from upstairs to the cooler basement to reduce air conditioning load while evening out temperatures. My HVAC system could use more air exchange between floors—especially between the basement and upper stories. I’m working on this.
- I might not have properly factored in all the electricity used by my experimental, backyard plasma chamber.*
So, maybe the next four months will reveal a miraculous catch-up of solar production to consumption. Even if not, I do have some improvements in mind to increase the efficiency of my HVAC systems, and that should help for next year. Time will tell. And when it does, I’ll report back with final results from the end of Solar Year One at Clintonville Passive House.
Thanks as always for reading.
*No, not really.
Subscribe
Sign up for notifications of the latest blog posts and exclusive content as it comes out!

Leave a comment